
Webservices33
Web Zen Garden
Embedding Interactive Python Plots on the Web.
A guide on how to use Plotly Chart Studio and Datapane to share Python plots on the web.
Introduction
One of the most important steps in the Data Science pipeline is Data Visualization. In fact, thanks to Data Visualization, Data Scientists can be able to quickly gather insights about the data they have available and any possible anomaly.
Traditionally, Data Visualization consisted of creating static images and summary statistics which could then be exported as images (e.g. PNG, JPG, SVG) using Python and libraries such as Matplotlib. Although, thanks to the development of libraries such as Plotly, Bokeh or Altair it is now possible to create much more interactive visualizations and even online dashboards which can be shared with colleagues and shareholders.
Once finished working on a project, there are typically two different approaches that you can use to share your visualizations and results with any interested party:
- Creating some form of data-driven presentation.
- Creating a project summary internal webpage with embedded any interactive plots created.
In this article we are now going to explore this second approach, presenting two possible solutions: Plotly Chart Studio and Datapane. All the code used for this article, is publicly available on my GitHub account at this link.
Plotly Chart Studio
Plotly is an open-source Python library built on plotly.js. Using Plotly, you can be able to create interactive graphs and dashboards using programming languages such as Python, R, Julia and Javascript.
In order to create easily sharable graphs, Plotly provides a chart studio service. Using this service, you can either create a plot as usual by programming and then add it to your online collection, or you can upload your data through the online user interface and create your graphs from there (without any need to code at all). Some examples of plots created using Plotly Chart Studio, are available at this link.
For this example, we are going to use the programming option using Python and the freely available Kaggle Students Performance in Exams dataset [1]. In case you are interested in exploring also the user interface to create your graphs, Plotly provides a list of guided tutorials available at this link.
In order to get started with Plotly Chart Studio, we need first to create an account and then install the Python library using the following command:
pip install chart_studio
At this point, we need to save our account API key, so that to be able to share graphs created using Python into our online account. This can be found by logging in to your account, going to Settings and then API Keys.
We are now ready to start our data exploratory analysis.
Data Visualization
First of all, we need to import all the necessary dependencies and inspect the head of the Students Performance in Exams dataset (Figure 1).
					import pandas as pd
import chart_studio
import plotly.express as px
import chart_studio.plotly as py

df = pd.read_csv('/kaggle/input/students-performance-in-exams/StudentsPerformance.csv')
df.head()
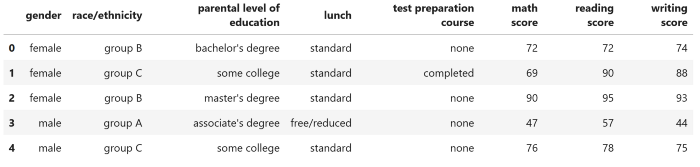
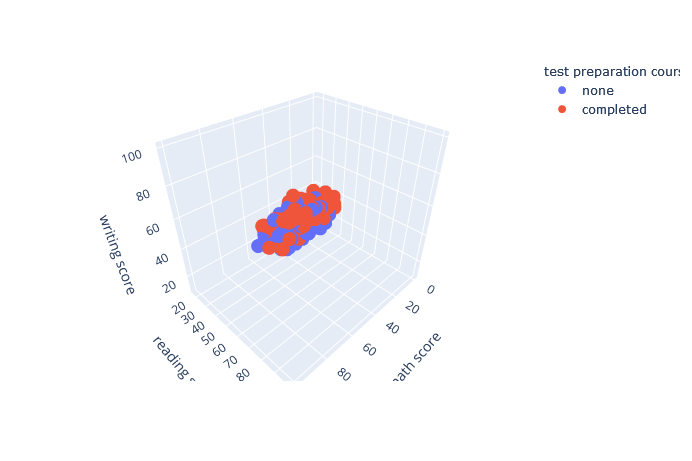
Using the following code snippet, we can then create a 3D scatterplot and save it to our online collection as 3d_embed_ex (remember to add your Plotly Chart Studio username and the API Key you copied before from your account settings).
					chart_studio.tools.set_credentials_file(username='TODO',
                                        api_key='TODO')

fig = px.scatter_3d(df, x='math score', y='reading score', z='writing score',
                    color='test preparation course')
py.plot(fig, filename = '3d_embed_ex', auto_open=True)
fig.show()
Going to your Plotly Chart Studio account and your My Files section, you should then be able to see the graph you just created in Python.
Clicking on Share and then on the Embed tab, you would then be able to see the iframe and HTML code you can use to share your interactive plot anywhere on the web (as shown in Figure 2 below).
Datapane
Datapane is a Python library designed in order to make it easier to share any form of data analysis through web embeds, automatically generated HTML files and much more. One of the main advantages of using Datapane, is its support to many data visualization libraries such as: matplotlib, plotly, bokeh, pandas and many more.
Additionally, using Datapane, it is also possible to share, not just individual plots but also collections of plots and Latex/Markdown text.
In order to get started with Datapane, we need first to create a free account and get our API key in the same way we did with Plotly Chart Studio.
The Python library can then be installed using the following command:
pip install datapane
Data Visualization
In order to provide a demonstration of how Datapane can be used, the Students Performance in Exams dataset (shown in Figure 1), is going to be used again.
Using then the following code snippet, a Datapane embed can be created (remember to add you Datapane API Key you copied before from your account settings).
Additionally, using the save option, it can also be possible to create an HTML file version of your report which you could then share with anyone you want without having to make your report publicly available on the web.
					import pandas as pd
import datapane as dp
import plotly.express as px

dp.login("TODO")
fig = px.scatter_3d(df, x='math score', y='reading score', z='writing score',
                    color='test preparation course')

report = dp.Report(
  dp.Text('# Students Performance in Exams'),
  dp.Plot(fig, caption="Interactive plot embedded on the web")
)

report.save("3d_embed_ex2.html", open=True)
report.upload(name='3d_embed_ex2')

fig.show()
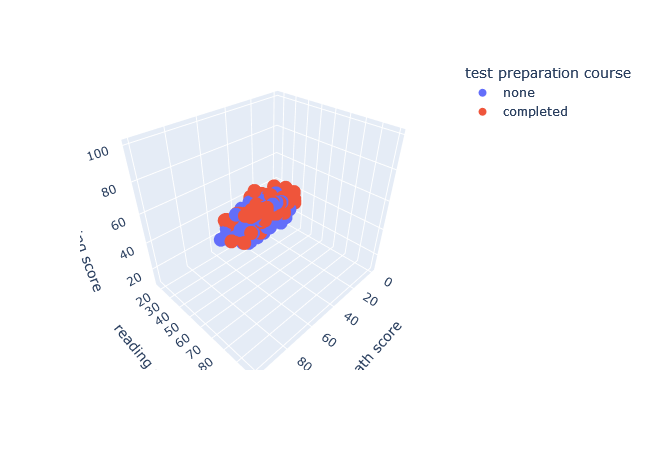
In order to share your newly created report, you can then just go to your Datapane account, click on My Reports, select the report you are interested in and click on Share (Figure 3).
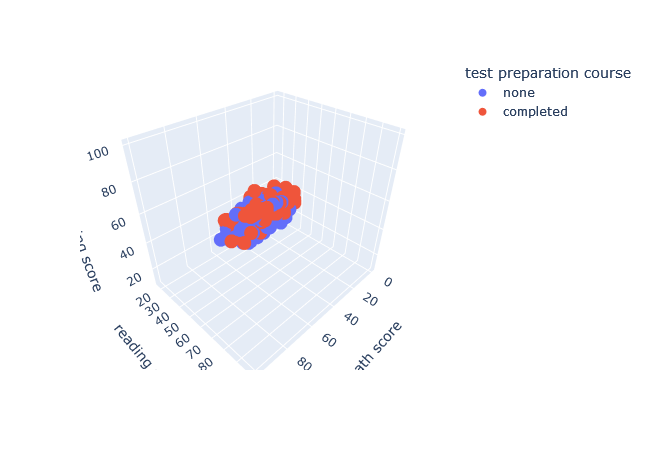
More complicated reports could then be created by adding more pages and visualizations (Figure 4). In the following example, a two pages report is created: one to show the first five rows of the dataset and one to show instead a 3D Scatter plot.
					fig = px.scatter_3d(df, x='math score', y='reading score', z='writing score',
                    color='test preparation course')

report = dp.Report(
    dp.Page(
        title="Overview",
        blocks=["# Students Performance in Exams",
                dp.Table(df.head(), caption="Dataframe Head")]),
    dp.Page(
        title="Plot",
        blocks= [
            dp.Text('# Math, Reading and Writing scores comparison'),
            dp.Plot(fig, caption="Interactive plot embedded on the web")]
    )
)

report.upload(name='3d_embed_ex3')

fig.show()
Conclusion
In this article, we explored Plotly Chart Studio and Datapane as two possible options to embed interactive charts on the web. Creating interactive charts can also be useful not just for preparing and exploring data but also to create visualizations and interfaces about Machine Learning models. Two of the most common libraries used for these kinds of tasks are Streamlit and Gradio. Additional information about this topic, is available in my “Machine Learning Visualization” article.
Contacts
If you want to keep updated with my latest articles and projects follow me on Medium and subscribe to my mailing list. These are some of my contacts details:
Bibliography
[1] “Student’s Performance in exams” (SATWIK VERMA, License CC0: Public Domain). Accessed at: https://www.kaggle.com/datasets/satwikverma/students-performance-in-exams
Webservices33 Web Zen Garden. © 2026-2027